前言

仿真数据集的产生需要有大量的重复工作,包括两类:一类是与仿真环境交互、获取准物理真实信息(数据采集),另一类是根据准物理真实信息、生成用于训练和测试的数据集(数据标注),两个工作都是相当繁琐的且不可能手工重复操作的,因此有必要开发自动化的数据采集插件或者程序。基于以上分析,这里简要记录利用Gazebo和ROS开发的自动化数据采集插件以及基于Python开发的自动化数据标注程序的主要流程,以供后来者参考。

自动化数据采集插件

本部分介绍使用C++调用gazebo接口完成对传感器信号的自动化采集。

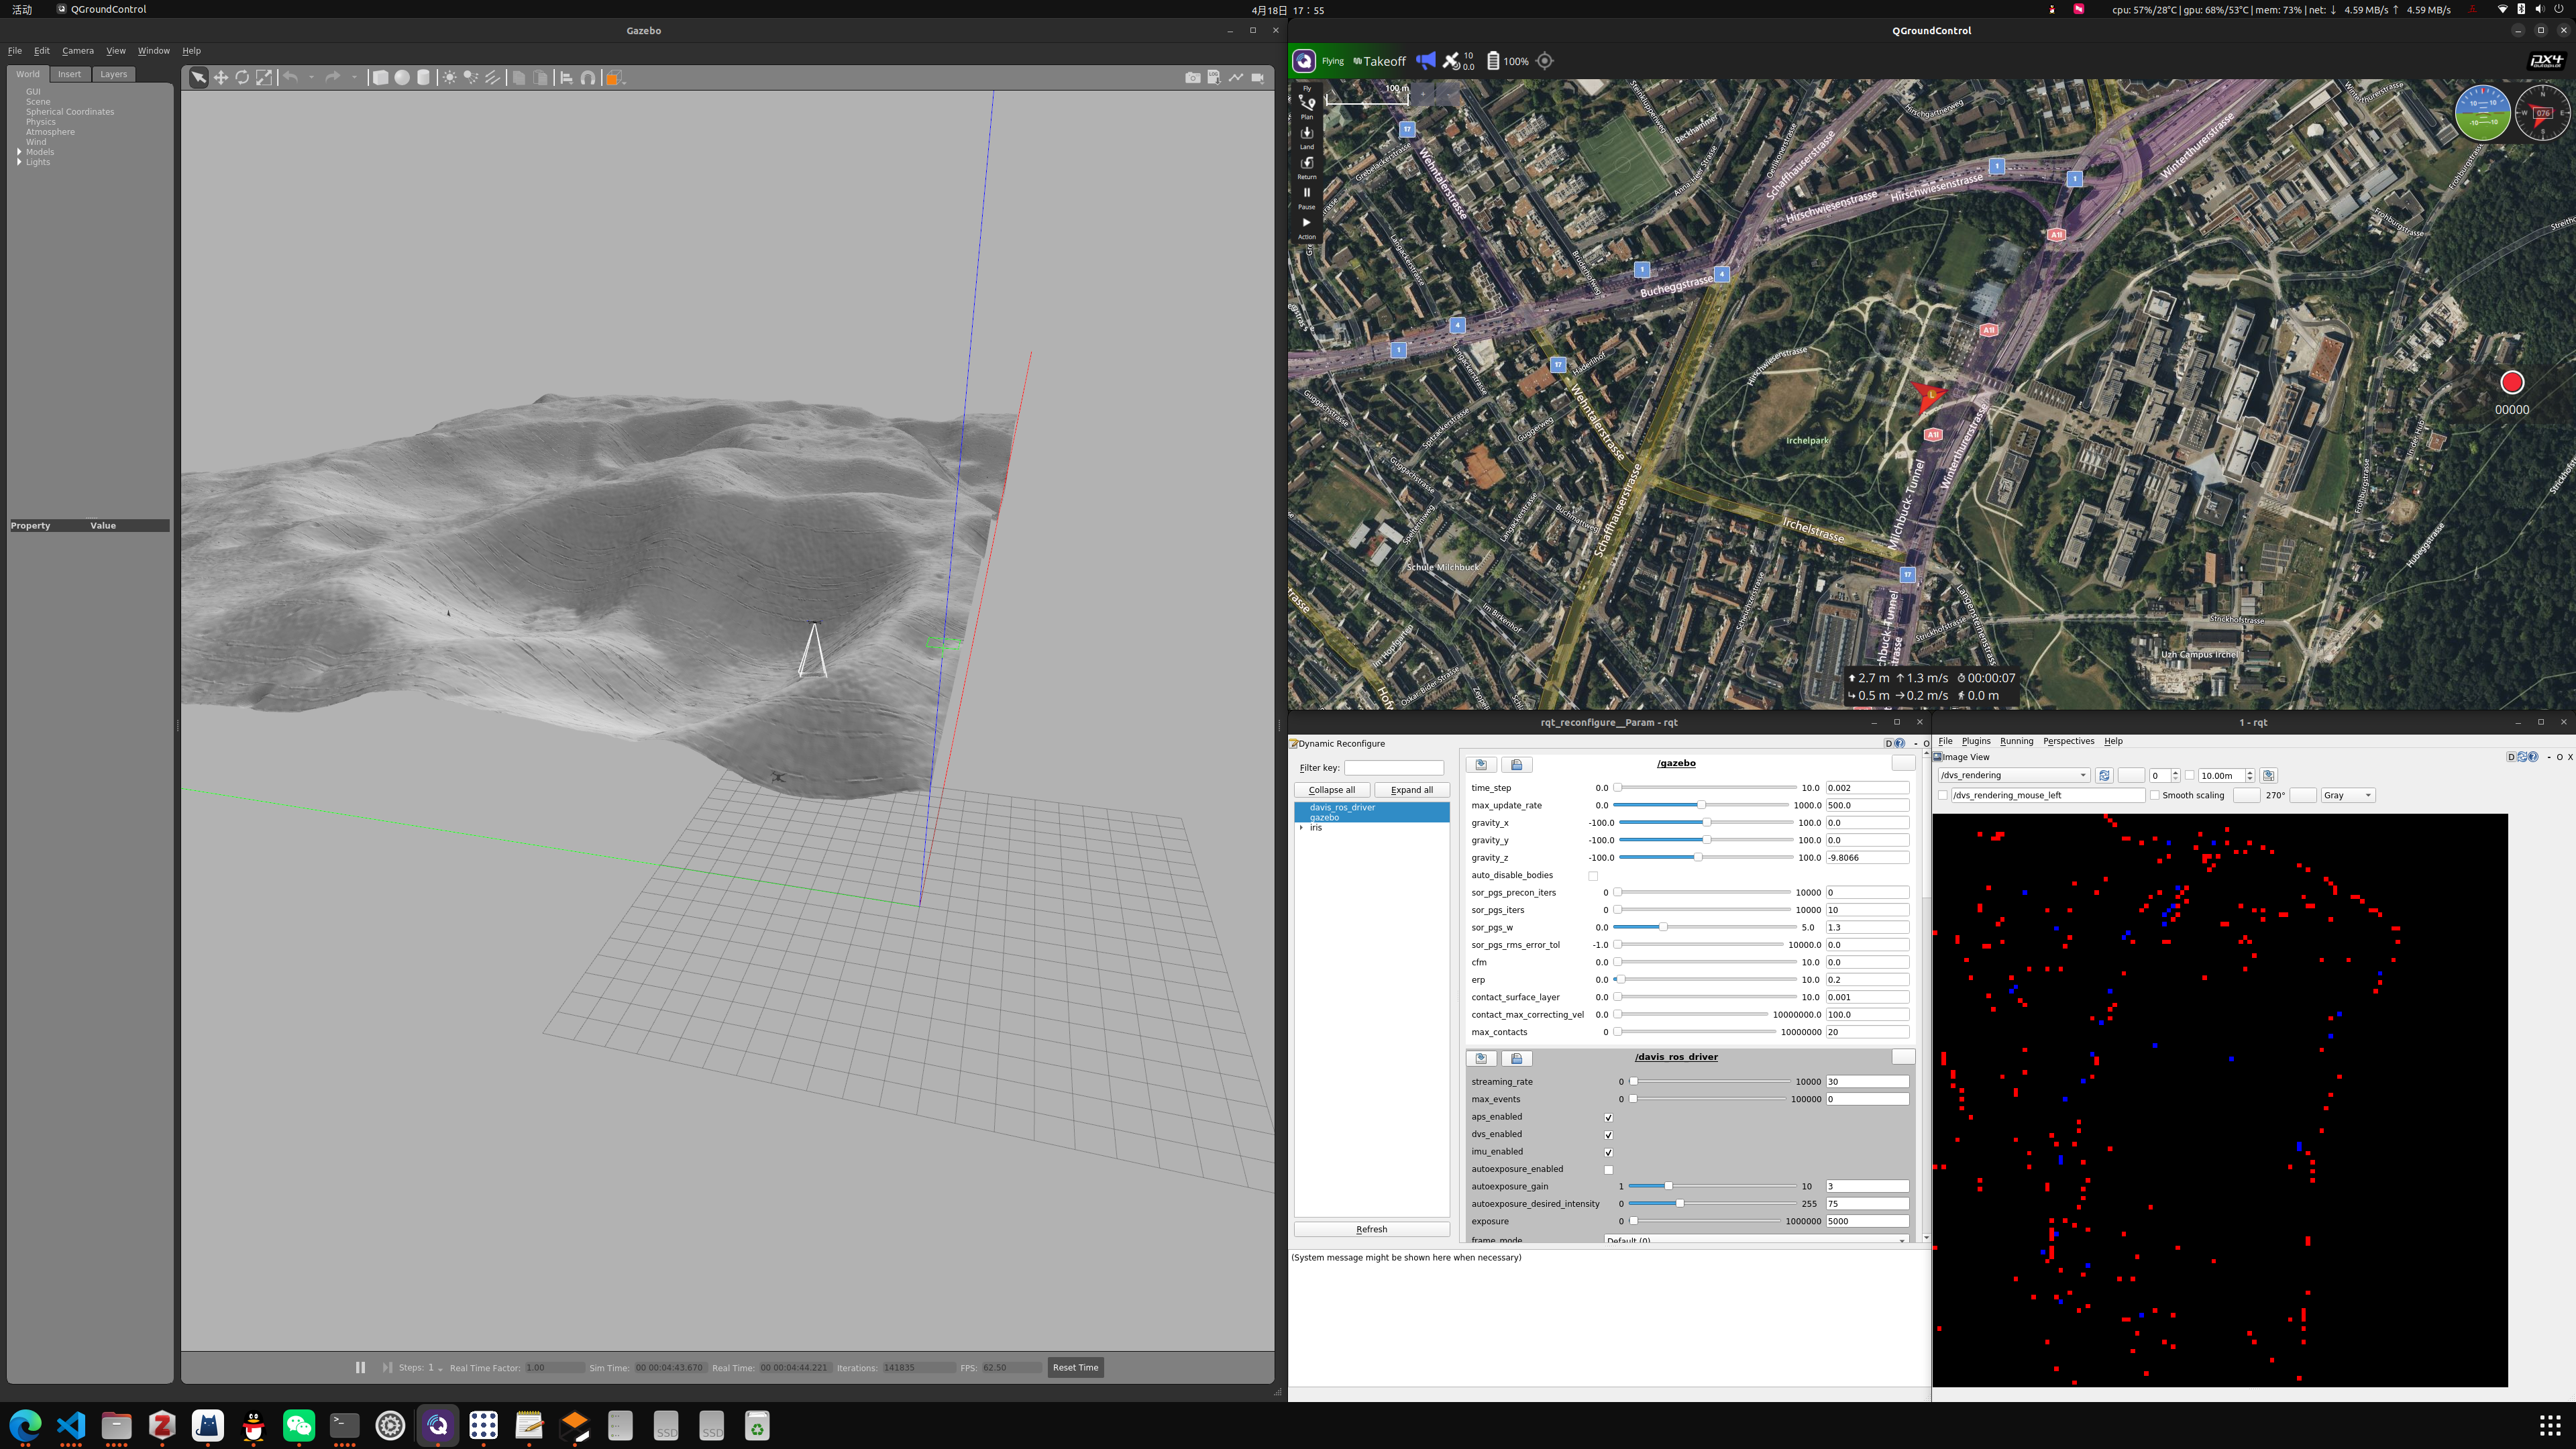
中间因为遥感图像预处理的问题,耽搁了快两个月,不过最近花了一个周把它彻底解决了,具体体现在,完成了三维仿真环境的搭建和无人机轨迹规划、传感器数据自动采集以及GT数据的生成,一整套下来踩了很多个坑,好好记录一下。

插件功能

关于插件,最重要的功能是自动化获取无人机设备全局坐标与全局姿态,通过Mavlink协议获取无人机载相机和事件相机时刻拍摄得到的照片和事件流信息,以此可以在离线情况下完成包括GT图像生成、姿态确定和陨石坑编码等一系列工作,主要是工程上的问题。

插件代码

catkin_ws工作目录下,使用命令创建项目工程:

1
catkin_create_pkg data_collector geometry_msgs roscpp dvs_msgs sensor_msgs

代码没有什么技术含量,主要是调用OpenCV和Ignition的API完成信号获取与解算,稍微复杂一点的标定程序不归自动化数据采集插件管,就没有什么好放上去的(主要都是在ChatGPT指导下完成的)。亦可以直接克隆现有的远程托管代码仓库,并编译,即有:

1
2
git clone git@github.com:BugBubbles/data_collector.git
catkin build

然后在绑定了事件相机的无人机模型SDF文件中,在<model>标签中增加如下内容:

1
2
3
4
5
6
7
<plugin name='data_collector' filename='libdata_collector.so'>
<enable>true</enable>
<image_sub>/iris/usb_cam/image_raw</image_sub>
<event_sub>/dvs/events</event_sub>
<output_dir>data_collected</output_dir>
<label_dir>Data/labels/circle</label_dir>
</plugin>

其中<image_sub>标签内填写的内容是无人机发布的图像订阅话题,<event_sub>填写的是无人机发布的事件流订阅话题(注意不是事件图像),<output_dir>填写的是保存的数据位置,如果不加根目录符号/,则目录将自动保存在以~/.ros开头的目录中,<label_dir>是用于读取当前已知的陨石坑标注数据的目录。开启<enable>标签,插件将自动获取以上信息。

采集数据格式

最终采集到的数据文件目录将以采集起始时刻为命名,结构如下所示:

1
2
3
4
5
6
7
8
9
10
11
.
└── 2024-07-06_19-39-04
   ├── images
   │   ├── 100.29.png
   │   ├── 100.89.png
   │   ├── 101.568.png
   │   ├── 102.21.png
   │   ├── 102.854.png
   │   ├── ...
   ├── events.csv
   └── pose.csv

其中获取到的图像流存放于images子文件夹中,以采集的时刻作为命名量;事件流和位姿信息存放于csv文件中。基于位姿信息和获取到的图像流,可以完成数据自动化标注。值得注意的是,采集的图像中存在相当多的空白图像(无人机未拍摄到图像或者Mavlink尚未建立联系),因此在数据标注时需要对空白图像作筛选去除。

自动化数据标注程序

标注过程往往是繁琐又痛苦的,如果真的一张一张标注,就等着延毕吧(硕士水平就这)。事实上,利用相机坐标系与世界坐标系的转换关系、陨石坑在世界坐标系的位置等物理已知信息,可以利用射影几何的知识完成自动化标注,这其中也踩坑无数。历经多次心态崩溃,最终完成了高精度的GT图像生成程序。

标注功能解说

由于本项目中,数据采集均是通过三维仿真环境生成,因此标注也务必要通过三维点信息获取,直接在平面图像上作射影变换获取的标注信息是必然存在误差的,且误差模式复杂,不便于补偿(有补偿这闲工夫都把其他方法试了个遍了),因此只能通过三维点向二维图像的摄像机变换获取标注点信息。而已知的陨石坑信息往往又只包含中心坐标和半径、长短轴等二维信息,默认陨石坑是二维几何形状,不能通过解析的三维曲线的射影变换等形式获取解析解,已知信息与需要的信息存在不匹配,造成了第一个需求:

  1. 将二维的标注信息三维化,产生三维空间标注点集,简称2D转3D

假设通过一系列高端操作得到了三维坐标下的标注陨石坑信息,另一个棘手的问题便是,如何根据位置、姿态信息完成坐标系转换、摄像机变换和图像变换,尤其是坐标系转换(gazebo的位姿定义方式、Ignition的位姿角返回值以及世界坐标系三个轴的关系)又是非常大的一个坑,极其容易犯错,因此第二个需求:

  1. 将三维标注信息二维化,得到标注图像,简称3D转2D

有了这两个需求后,就可以对症下药完成这个宏大的标注程序工程了,下面开始贴代码。

2D转3D

2D与3D信息沟通的桥梁是DEM模型,因此如何通过DEM完成这一转换?这里提供一种比较粗野(但是很有效的方法,可以勾画出准确的陨石坑外形以高次曲线的形式,而不是简单的圆或者椭圆)。其流程叙述如下:

  1. 获取标注量:读取现有陨石坑表,得到中心坐标和半径(简单起见,仅用圆模型,椭圆模型也是类似的),分区前的陨石坑表格下载位置可参考NASA官网。当然也可以直接参考我下载并分区好的文件夹,可见于ModelScope的链接
  2. 平面转立体:将待标注的陨石坑在DEM平面图上画出,并获取坑轮廓点坐标(DEM图像坐标系)和对应的高度,此时坐标已经变成了空间坐标,但是并不是物理空间的,而是DEM图像坐标系下的“空间”坐标;
  3. 空间拓展:根据DEM图像像素坐标与经纬度坐标的对应关系,可以直接把轮廓点的像素坐标转为经纬度坐标,而高度信息则以dn\mathrm{d}|\vec{n}|的形式,转为球面坐标系下的法向增量,由此得到了三维球坐标;
  4. 球面转直角:射影几何是直角坐标系下的几何关系,使用表示法将球面坐标系下的坐标,可以直接转为直角坐标系下的坐标,得到了真实的三维标注点坐标。

以上过程在程序中体现为如下成员函数:

1
2
3
4
5
6
7
8
9
10
11
12
13
14
15
16
17
18
19
20
21
22
23
24
25
26
27
28
29
30
31
32
33
34
def findCraters(self, dem, data):
"""
从DEM中找到所有的陨石坑的边缘三维点,并将其坐标转为直角坐标
"""
points = []
for x, y, lat, lon, r in tqdm.tqdm(data, desc="Preparing for crater points"):
D_x, D_y = distortCircle(lat, r) # 逐纬度求解陨石坑变形后的长短轴,即将球面坐标投影为DEM平面坐标
mask = np.zeros_like(dem, dtype=np.int16)
cv2.ellipse(
mask,
(int(y), int(x)),
(int(D_y / 2), int(D_x / 2)),
0,
0,
360,
1,
2,
) # 在DEM图像平面上画出陨石坑轮廓椭圆
img = mask * dem # 把陨石坑轮廓对应位置处的高度信息提取出来
dr = img[mask != 0] / scale_factor # 提取高度信息,这里的scale_factor是DEM图像的高度从单位米缩放为像素单位
coor = cv2.findNonZero(mask).squeeze()
lat, lon = plane2sphere(coor[:, 1], coor[:, 0]) # 将DEM图像坐标转为球面坐标
points.append(sphere2xyz(lat, lon, dr))
# 原点平移至标准位置[0, 0, 0, 1]和标准姿态[0, 0, 1],由此校正全部其他点
points_ = np.concatenate(points, axis=1)
origin_point = self.origin_point * pi / 180
R = self.Rotate([0, pi / 2 - origin_point[0], origin_point[1]])
T = sphere2xyz(self.origin_point[0], self.origin_point[1], 0)
T = -R @ np.array(T)
points_ = np.pad(points_, ((0, 1), (0, 0)), "constant", constant_values=1)
H = np.hstack((R, T[:, None]))
H = np.vstack((H, np.array([0, 0, 0, 1])))
cali_points = H @ points_
return cali_points

这里有一个坑:

姿态角的含义?

查阅了Gazebo所使用的位姿表示库Igntion的官方文档,该文档提供了使用欧拉角和使用四元数表示两种方式,这里为了直观选用了欧拉角表示,三轴欧拉角分别记为俯仰角pitchθ\theta,偏航角yawϕ\phi,滚转角rollψ\psi。在Gazebo中,欧拉角的表示顺序是Z-Y-X,即先绕Z轴旋转θ\theta,再绕Y轴旋转ϕ\phi,最后绕X轴旋转ψ\psi,更为重要的是,欧拉角与旋转顺序有关,先绕Z轴旋转后,再绕Y轴是绕的新形成的Y轴,不再是原始的旧轴(欧拉角的万向锁效应)。

3D转2D

在给定相机位置和姿态后,应当能够根据内外参矩阵完成摄像机变换。与一步类似,也需要完成坐标系的平移和旋转,此时需要平移的坐标系应当是世界坐标系,将其变换为图像坐标系,然后根据齐次坐标的完成图像坐标的解算。本步骤中可以使用以下成员函数完成:

1
2
3
4
5
6
7
8
9
10
11
12
13
14
15
16
17
18
19
20
21
22
23
24
25
26
27
28
29
30
31
32
33
34
35
36
37
def __call__(self, t, pose, ori, output_dir, img=None):
"""
输入的是相机在世界坐标系下的位置和姿态,需要输出的是当前位姿条件下陨石坑在图像坐标系下各点位置
Arguments:
t (str|float) : 时间戳
pose (list) : Gazebo仿真输出的位置
ori (list) : Gazebo仿真输出的欧拉角姿态,按照Z-Y-X顺序,pitch-yaw-roll顺序排列结果
img (np.ndarray) : 用于显示的图像, optional
"""
output_dir = os.path.join(output_dir, "gt_images")
if not os.path.exists(output_dir):
os.makedirs(output_dir)
if img is None:
img = np.zeros(self.size, dtype=np.uint8)
p = self.world2camera(pose, ori)
p = np.int32(p)
p = self.clip(p)
img[p[1], p[0], ...] = 255
cv2.imwrite(f"{output_dir}/{t}.png", img)

def world2camera(self, pose, ori):
R = self.Rotate(ori)
# R_ 调整相机坐标系和图像坐标系的坐标转换,即y轴x轴互换
R_ = np.array([[0, 1, 0, 0], [1, 0, 0, 0], [0, 0, 1, 0], [0, 0, 0, 1]])
T = -R @ np.array(pose)
H = np.hstack((R, T[:, None]))
H = np.vstack((H, np.array([0, 0, 0, 1])))
homo_points = self.K @ R_ @ H @ self.points
# 齐次坐标转绝对坐标
p = homo_points[:2] / homo_points[-1]
return p

def clip(self, points):
x = points[0]
y = points[1]
ind = (x < self.size[0]) & (x >= 0) & (y < self.size[1]) & (y >= 0)
return points[:, ind]

只需要输入当前的时间戳、位姿信息,程序将自动完成位姿解算。标注的示意图如下所示:

以上标注情况是根据三维坐标标注的,因此结果将比直接依据二维图像和二维几何形状的射影变换更加精确。图中也显示,标注陨石坑轮廓可以不呈现出椭圆,而是更加复杂曲线形式,以更加适合陨石坑轮廓在当前情况下真实走向。完整的标注程序代码如下所示:

1
2
3
4
5
6
7
8
9
10
11
12
13
14
15
16
17
18
19
20
21
22
23
24
25
26
27
28
29
30
31
32
33
34
35
36
37
38
39
40
41
42
43
44
45
46
47
48
49
50
51
52
53
54
55
56
57
58
59
60
61
62
63
64
65
66
67
68
69
70
71
72
73
74
75
76
77
78
79
80
81
82
83
84
85
86
87
88
89
90
91
92
93
94
95
96
97
98
99
100
101
102
103
104
105
106
107
108
109
110
111
112
113
114
115
116
117
118
119
120
121
122
123
124
125
126
127
128
129
130
131
132
133
134
135
136
137
138
139
140
141
142
143
144
145
146
147
148
149
150
151
152
153
154
155
156
157
158
159
160
161
162
163
164
165
166
167
168
169
170
171
172
173
174
175
176
177
178
179
180
181
182
183
184
185
186
187
188
189
190
191
192
193
194
195
196
197
198
199
200
201
202
203
204
205
206
207
208
209
210
211
212
213
214
215
216
217
218
219
220
221
222
223
224
225
226
227
228
229
230
231
232
233
234
235
236
237
238
239
240
241
242
243
244
245
246
247
248
249
250
251
252
253
254
255
256
257
258
259
260
261
262
263
264
265
266
267
268
269
270
271
272
273
274
275
276
277
278
279
280
281
282
283
284
285
286
287
288
289
290
291
292
293
294
295
296
"""用于从gazebo生成的仿真图像中获取GT信息
"""

import numpy as np
import cv2
import os
import tqdm
from math import cos, pi, radians, sin
import argparse

LABEL_BYTES = 984003
BYTES_PER_PIXEL = 2
LINES = 61440
LINE_SAMPLES = 184320
LATITUDE_RANGE = 120 # deg
LONGITUDE_RANGE = 360 # deg
X_PIXEL_RANGE = 61440
Y_PIXEL_RANGE = 184320
scale_factor = 0.1 # 比例系数
MOON_RADIUS = 1737.4 # km
radius = MOON_RADIUS * 1000 / 59 * scale_factor
BASE_BATCH = 960


def arg_parse():
arg_parser = argparse.ArgumentParser()
arg_parser.add_argument(
"-c",
"--collect_dir",
type=str,
help="The directory of the collected data",
)
arg_parser.add_argument(
"-l",
"--label_dir",
type=str,
default="/home/docker/.ros/Data",
help="The directory of the label data",
)
return arg_parser.parse_args()


def sphere2xyz(lat, lon, dr):
"""
Warning ! The unit of latitude and longitude is degree.
Arguments:
lat (float) : latitude, from -90 to 90
lon (float) : longitude, from 0 to 360
"""
lat = lat / 180 * pi
lon = lon / 180 * pi
x = (radius + dr) * np.cos(lat) * np.cos(lon)
y = (radius + dr) * np.cos(lat) * np.sin(lon)
z = (radius + dr) * np.sin(lat)
return x, y, z


def plane2sphere(x, y):
"""
Return:
lat (float) : latitude in degree, from -60 to 60
lon (float) : longitude in degree, from 0 to 360
"""
lat = 60 - x * LATITUDE_RANGE / X_PIXEL_RANGE
lon = y * LONGITUDE_RANGE / Y_PIXEL_RANGE
return lat, lon


def distortCircle(lat, d):
"""
Arguments:
lat (float) : latitude in degree, from -60 to 60
d (float) : diameter in meter
"""
D_x = d / MOON_RADIUS * X_PIXEL_RANGE / radians(LATITUDE_RANGE)
D_y = d / MOON_RADIUS * Y_PIXEL_RANGE / radians(LONGITUDE_RANGE) / cos(radians(lat))
return D_x, D_y


class GTGen:
def __init__(
self,
label_dir,
row: range,
col: range,
origin_point: tuple,
K: tuple,
size: tuple,
):
dem = np.zeros((BASE_BATCH * len(row), BASE_BATCH * len(col)), dtype=np.int16)
data = np.zeros((0, 5), dtype=np.float32)
for row_ in row:
for col_ in col:
dem_, data_ = self._load(label_dir, row_, col_)
dem[
row_ * BASE_BATCH : (row_ + 1) * BASE_BATCH,
col_ * BASE_BATCH : (col_ + 1) * BASE_BATCH,
] = dem_
data = np.vstack((data, data_))
self.dem_ = dem
self.origin_point = np.array(origin_point)
self.K = np.array(K).reshape(3, 4)
self.size = size
self.points_ = self.findCraters(self.dem_, data)

@property
def dem(self):
return self.dem_

@property
def points(self):
return self.points_

def findCraters(self, dem, data):
"""
从DEM中找到所有的陨石坑的边缘三维点,并将其坐标转为直角坐标
"""
points = []
for x, y, lat, lon, r in tqdm.tqdm(data, desc="Preparing for crater points"):
D_x, D_y = distortCircle(lat, r)
mask = np.zeros_like(dem, dtype=np.int16)
cv2.ellipse(
mask,
(int(y), int(x)),
(int(D_y / 2), int(D_x / 2)),
0,
0,
360,
1,
2,
)
img = mask * dem
dr = img[mask != 0] / scale_factor
coor = cv2.findNonZero(mask).squeeze()
lat, lon = plane2sphere(coor[:, 1], coor[:, 0])
points.append(sphere2xyz(lat, lon, dr))
# 原点平移至标准位置
points_ = np.concatenate(points, axis=1)
origin_point = self.origin_point * pi / 180
R = self.Rotate([0, pi / 2 - origin_point[0], origin_point[1]])
T = sphere2xyz(self.origin_point[0], self.origin_point[1], 0)
T = -R @ np.array(T)
points_ = np.pad(points_, ((0, 1), (0, 0)), "constant", constant_values=1)
H = np.hstack((R, T[:, None]))
H = np.vstack((H, np.array([0, 0, 0, 1])))
cali_points = H @ points_
return cali_points

def __call__(self, t, pose, ori, output_dir, img=None):
"""
输入的是相机在世界坐标系下的位置和姿态,需要输出的是当前位姿条件下陨石坑在图像坐标系下各点位置
Arguments:
t (str|float) : 时间戳
pose (list) : Gazebo仿真输出的位置
ori (list) : Gazebo仿真输出的欧拉角姿态,按照Z-Y-X顺序,pitch-yaw-roll顺序排列结果
img (np.ndarray) : 用于显示的图像, optional
"""
output_dir = os.path.join(output_dir, "gt_images")
if not os.path.exists(output_dir):
os.makedirs(output_dir)
if img is None:
img = np.zeros(self.size, dtype=np.uint8)
p = self.world2camera(pose, ori)
p = np.int32(p)
p = self.clip(p)
img[p[1], p[0], ...] = 255
cv2.imwrite(f"{output_dir}/{t}.png", img)

@staticmethod
def _load(label_dir, row_, col_):
with open(
os.path.join(
label_dir, f"labels/circle/{row_}/lbl_{row_}_{col_}_{BASE_BATCH}.txt"
),
"r",
) as reader:
dem = np.load(
os.path.join(
label_dir, f"dem_int16/{row_}/dem_{row_}_{col_}_{BASE_BATCH}.npz"
)
)["arr_0"]
data = np.array(
list(
map(
lambda x: [
float(x[0]) + row_ * BASE_BATCH, # x
float(x[1]) + col_ * BASE_BATCH, # y
float(x[5]), # lat
float(x[6]), # lon
float(x[7]), # radius
],
map(lambda line: line.strip().split(","), reader),
)
)
)
return dem, data

def Rotate(self, ori):
"""
三轴转角
"""
x, y, z = ori
R_x = np.array(
[
[1, 0, 0],
[0, cos(x), sin(x)],
[0, -sin(x), cos(x)],
]
)
R_y = np.array(
[
[cos(y), 0, -sin(y)],
[0, 1, 0],
[sin(y), 0, cos(y)],
]
)
R_z = np.array(
[
[cos(z), sin(z), 0],
[-sin(z), cos(z), 0],
[0, 0, 1],
]
)

return R_x @ R_y @ R_z

def world2camera(self, pose, ori):
R = self.Rotate(ori)
# R_ 调整相机坐标系和图像坐标系的坐标转换,即y轴x轴互换
R_ = np.array([[0, 1, 0, 0], [1, 0, 0, 0], [0, 0, 1, 0], [0, 0, 0, 1]])
T = -R @ np.array(pose)
H = np.hstack((R, T[:, None]))
H = np.vstack((H, np.array([0, 0, 0, 1])))
homo_points = self.K @ R_ @ H @ self.points
# 齐次坐标转绝对坐标
p = homo_points[:2] / homo_points[-1]
return p

def clip(self, points):
x = points[0]
y = points[1]
ind = (x < self.size[0]) & (x >= 0) & (y < self.size[1]) & (y >= 0)
return points[:, ind]


if __name__ == "__main__":
args = arg_parse()
sub_dir = args.label_dir
collected_dir = args.collect_dir

num_batches = LINES // BASE_BATCH
num_samples = LINE_SAMPLES // BASE_BATCH
row = list(range(0, 3))
col = list(range(0, 5))

delta_theta = 120 / num_batches
delta_phi = 360 / num_samples
origin_point = (
60 - delta_theta * row[len(row) // 2],
# delta_phi * col[len(col) // 2],
0,
)
K = (
101.574547,
0.0,
128.5,
-0.0,
0.0,
101.574547,
128.5,
0.0,
0.0,
0.0,
1.0,
0.0,
)
gt_gen = GTGen(sub_dir, row, col, origin_point, K, (256, 256))
image_names = list(
map(
lambda x: x.removesuffix(".png"),
os.listdir(f"{collected_dir}/images"),
)
)
with open(f"{collected_dir}/pose.csv", "r") as f:
for line in f:
# 某个时刻的姿态
data = line.split(",")
time = data[0]
if time not in image_names:
continue
if float(time) < 60:
continue
pose = list(float(x) for x in data[1:4])
ori = [float(data[6]), float(data[4]), float(data[5])]
img = cv2.imread(f"{collected_dir}/images/{time}.png")
gt_gen(time, pose, ori, collected_dir, img)